A Powerful Chart & Scale Generator for Adobe Illustrator
Creating clean, consistent numeric scales in Adobe Illustrator can be surprisingly time-consuming. Whether you’re building infographics, UI mockups, data visualizations, timelines, pricing tables, or technical diagrams, manually typing and aligning sequential values is repetitive and error-prone.
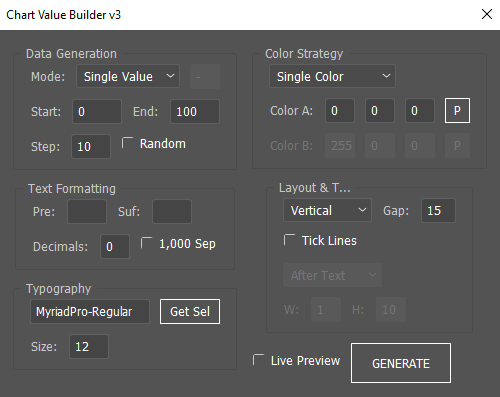
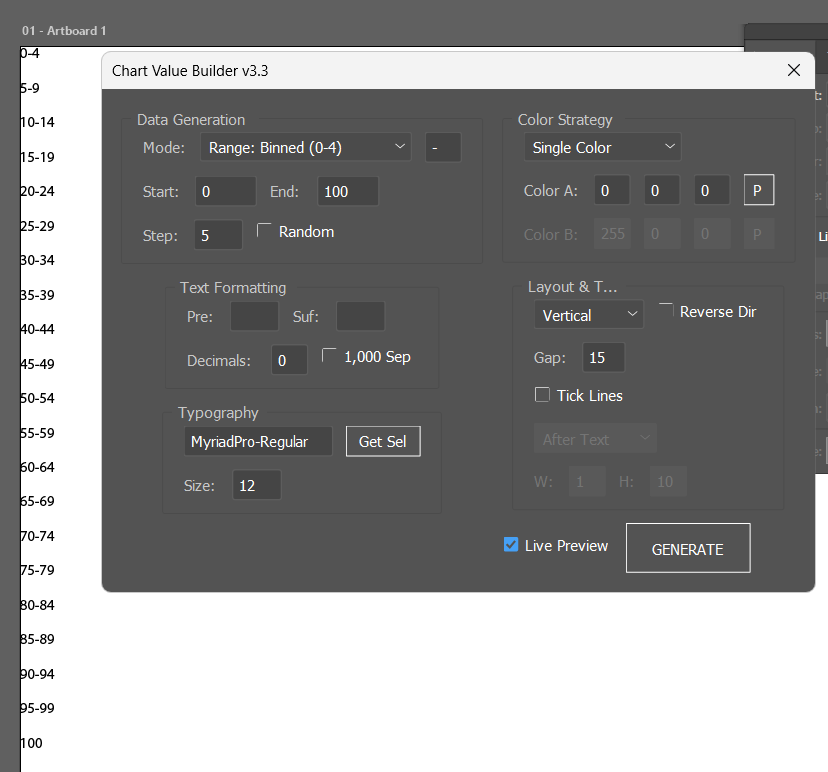
Advanced Sequential Value Builder v3.0 solves that problem with a flexible, intelligent, and highly customizable system for generating structured numeric content directly inside Illustrator.
Let’s explore what makes this script so powerful.
🚀 What This Script Does
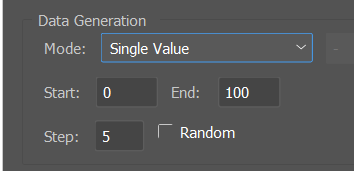
This tool automatically generates sequential numeric values — either as:
- Single values (0, 10, 20, 30…)
- Range values (0–10, 10–20, 20–30…)
It builds fully formatted text objects, applies typography, assigns color strategies, optionally adds tick marks, and organizes everything in vertical or horizontal layouts.
All in one panel.
🧠 Smart Value Logic
1. Single vs Range Mode
You can choose between:
- Single Value Mode
Example:01020 - Range Mode
Example:0–1010–2020–30
You can also customize the separator (e.g., “-“, “–”, “to”, etc.).
2. Automatic Inverse Detection
If your start value is larger than your end value (e.g., 100 → 0), the script automatically switches to countdown mode.
No need to manually enter negative steps.
It intelligently detects direction and adjusts the increment accordingly.
3. Random Step Mode
Instead of fixed increments, you can enable Random Mode, which generates dynamic step values.
This is especially useful for:
- Experimental layouts
- Abstract data visuals
- Creative number compositions
- Generative design workflows
🎨 Advanced Color Strategies
Color application goes far beyond simple fills.
Available Modes:
• Single Color
All values share one color.
• Alternating (A/B)
Perfect for readability in long lists.
• Gradient (A → B)
Automatically interpolates between two colors based on value position.
This creates beautiful visual transitions for:
- Temperature scales
- Progress indicators
- Time sequences
- Data ranges
And yes — it includes native Illustrator color picker integration for intuitive selection.
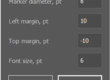
✍️ Full Typography Control
You can fully define:
- Font name
- Font size
- Prefix (e.g., “$”)
- Suffix (e.g., “%”)
- Decimal precision
- Thousand separators (1,000 format)
There’s even a “Get Selected” button that reads typography directly from a selected text object. This makes matching your existing design system effortless.
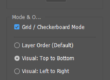
📐 Layout & Direction Options
The script supports:
- Vertical stacking
- Horizontal row layout
- Custom spacing between items
Each generated value is placed inside its own group, ensuring clean structure and easy repositioning later.
📏 Tick Line System
You can optionally add tick marks to each value — ideal for:
- Chart axes
- Measurement scales
- Timelines
- UI sliders
Features:
- Before or After positioning
- Adjustable stroke width
- Adjustable length
- Automatic alignment relative to text bounds
- Tick color matches text color
The script dynamically calculates text bounds and places the line correctly whether the layout is vertical or horizontal.
🔄 Live Preview Mode
One of the most powerful features is Live Preview.
When enabled:
- The script generates a temporary preview layer
- Updates automatically as you change values
- Cleans up after itself when disabled
This gives you a near real-time design experience without permanently committing changes.
🏗️ Clean Document Structure
Final output is:
- Grouped under a single container
- Properly structured
- Non-destructive
- Easy to move, scale, or style further
Preview elements are isolated in a temporary layer and removed automatically when generating the final output.
💡 Real-World Use Cases
This script is perfect for:
- Infographic design
- Dashboard UI mockups
- Financial scales
- Data visualization
- Measurement rulers
- Architectural diagrams
- Technical drawings
- Timeline graphics
- Price ladders
- Survey scales
- Generative typography experiments
If your workflow involves structured numeric repetition, this tool dramatically speeds things up.
⚙️ Why It’s Different
Many Illustrator scripts generate simple sequences.
This one behaves more like a mini data engine.
It combines:
- Smart logic detection
- Flexible formatting
- Visual styling controls
- Layout intelligence
- Live preview system
- Gradient math
- Dynamic grouping
- Native color integration
All inside a clean two-column interface.
🎯 Who Is This For?
- Graphic Designers
- Motion Designers
- UI/UX Designers
- Data Visualization Artists
- Technical Illustrators
- Infographic Creators
- Generative Design Enthusiasts
If you regularly build scales, sequences, or structured numeric graphics — this script will become a core utility in your Illustrator toolkit.
🔚 Final Thoughts
Advanced Sequential Value Builder v3.0 turns a repetitive manual process into a fast, dynamic, and highly customizable workflow.
It bridges the gap between data logic and visual design — directly inside Adobe Illustrator.
If you work with structured numbers, this isn’t just convenient — it’s transformative.
/*
  Chart Value Builder v3.3
  For Adobe Illustrator

  Updates in v3.3:
  - Added "Reverse Layout" checkbox.
    * Vertical + Reverse = Bottom to Top (Good for Y-Axis)
    * Horizontal + Reverse = Right to Left (Good for RTL charts)
  - Preserved Binned Range (0-4) logic from v3.2
*/

(function() {
    if (app.documents.length === 0) {
        alert("Please open a document first.");
        return;
    }

    var doc = app.activeDocument;
    var scriptName = "Chart Value Builder v3.3";
    var previewLayerName = "---PREVIEW_TEMP---";

    // --- DEFAULTS ---
    var settings = {
        mode: 2, // Default: Binned (0-4)
        rangeSep: "-",
        start: 0, end: 100, step: 5,
        random: false,
        decimals: 0, separator: false,
        prefix: "", suffix: "",
        fontName: "MyriadPro-Regular", fontSize: 12,
        direction: "Vertical", spacing: 15, reverse: false,
        colorMode: "Single",
        c1: [0, 0, 0], c2: [255, 0, 0],
        linePos: "After", lineWidth: 1, lineLen: 10
    };

    // --- HELPER: COLORS ---
    function makeRGB(r, g, b) {
        var c = new RGBColor();
        c.red = r; c.green = g; c.blue = b;
        return c;
    }

    function openColorPicker(rField, gField, bField) {
        var c = new RGBColor();
        c.red = parseFloat(rField.text);
        c.green = parseFloat(gField.text);
        c.blue = parseFloat(bField.text);

        if (app.showColorPicker(c)) {
            rField.text = Math.round(c.red);
            gField.text = Math.round(c.green);
            bField.text = Math.round(c.blue);
            return true;
        }
        return false;
    }

    // --- UI BUILDER ---
    var win = new Window("dialog", scriptName);
    win.orientation = "row";
    win.alignChildren = ["fill", "top"];

    // === LEFT COLUMN ===
    var colLeft = win.add("group");
    colLeft.orientation = "column";

    // 1. DATA PANEL
    var pData = colLeft.add("panel", undefined, "Data Generation");
    pData.alignChildren = ["left", "center"];

    // Mode Selection
    var gMode = pData.add("group");
    gMode.add("statictext", undefined, "Mode:");
    var dropMode = gMode.add("dropdownlist", undefined, ["Single Value", "Range: Continuous (0-5)", "Range: Binned (0-4)"]);
    dropMode.selection = settings.mode;

    var inpRangeSep = gMode.add("edittext", [0,0,30,25], settings.rangeSep);

    var g1 = pData.add("group");
    g1.add("statictext", undefined, "Start:");
    var inpStart = g1.add("edittext", [0,0,50,25], settings.start);
    g1.add("statictext", undefined, "End:");
    var inpEnd = g1.add("edittext", [0,0,50,25], settings.end);

    var g2 = pData.add("group");
    g2.add("statictext", undefined, "Step:");
    var inpStep = g2.add("edittext", [0,0,40,25], settings.step);
    var chkRand = g2.add("checkbox", undefined, "Random");

    // 2. TEXT PANEL
    var pText = colLeft.add("panel", undefined, "Text Formatting");
    pText.alignChildren = ["left", "center"];
    var g3 = pText.add("group");
    g3.add("statictext", undefined, "Pre:");
    var inpPre = g3.add("edittext", [0,0,40,25], settings.prefix);
    g3.add("statictext", undefined, "Suf:");
    var inpSuf = g3.add("edittext", [0,0,40,25], settings.suffix);

    var g4 = pText.add("group");
    g4.add("statictext", undefined, "Decimals:");
    var inpDec = g4.add("edittext", [0,0,30,25], settings.decimals);
    var chkSep = g4.add("checkbox", undefined, "1,000 Sep");

    // 3. FONT PANEL
    var pFont = colLeft.add("panel", undefined, "Typography");
    pFont.alignChildren = ["left", "center"];
    var gFont = pFont.add("group");
    var inpFont = gFont.add("edittext", [0,0,120,25], settings.fontName);
    var btnGetFont = gFont.add("button", undefined, "Get Sel");
    btnGetFont.size = [60,25];

    var gFSize = pFont.add("group");
    gFSize.add("statictext", undefined, "Size:");
    var inpSize = gFSize.add("edittext", [0,0,40,25], settings.fontSize);

    // === RIGHT COLUMN ===
    var colRight = win.add("group");
    colRight.orientation = "column";

    // 4. COLOR PANEL
    var pColor = colRight.add("panel", undefined, "Color Strategy");
    pColor.alignChildren = ["left", "center"];
    var dropColor = pColor.add("dropdownlist", undefined, ["Single Color", "Alternating (A/B)", "Gradient (A->B)"]);
    dropColor.selection = 0;

    // Color A Group
    var gC1 = pColor.add("group");
    gC1.add("statictext", undefined, "Color A:");
    var inpC1r = gC1.add("edittext", [0,0,30,25], "0");
    var inpC1g = gC1.add("edittext", [0,0,30,25], "0");
    var inpC1b = gC1.add("edittext", [0,0,30,25], "0");
    var btnPick1 = gC1.add("button", [0,0,25,25], "P");

    // Color B Group
    var gC2 = pColor.add("group");
    gC2.add("statictext", undefined, "Color B:");
    var inpC2r = gC2.add("edittext", [0,0,30,25], "255");
    var inpC2g = gC2.add("edittext", [0,0,30,25], "0");
    var inpC2b = gC2.add("edittext", [0,0,30,25], "0");
    var btnPick2 = gC2.add("button", [0,0,25,25], "P");
    gC2.enabled = false;

    // 5. LINES & LAYOUT
    var pLayout = colRight.add("panel", undefined, "Layout & Ticks");
    pLayout.alignChildren = ["left", "center"];

    var gDir = pLayout.add("group");
    var dropDir = gDir.add("dropdownlist", undefined, ["Vertical", "Horizontal"]);
    dropDir.selection = 0;

    // NEW: Reverse Checkbox
    var chkRev = gDir.add("checkbox", undefined, "Reverse Dir");
    chkRev.value = settings.reverse;

    var gGap = pLayout.add("group");
    gGap.add("statictext", undefined, "Gap:");
    var inpSpace = gGap.add("edittext", [0,0,35,25], settings.spacing);

    var chkLine = pLayout.add("checkbox", undefined, "Tick Lines");
    var gLineOpts = pLayout.add("group");
    gLineOpts.enabled = false;

    var dropLinePos = gLineOpts.add("dropdownlist", undefined, ["Before Text", "After Text"]);
    dropLinePos.selection = 1;

    var gLineDims = pLayout.add("group");
    gLineDims.enabled = false;
    gLineDims.add("statictext", undefined, "W:");
    var inpLThick = gLineDims.add("edittext", [0,0,30,25], "1");
    gLineDims.add("statictext", undefined, "H:");
    var inpLLen = gLineDims.add("edittext", [0,0,30,25], "10");

    // 6. ACTIONS
    var gAct = colRight.add("group");
    gAct.alignment = "fill";
    var chkPreview = gAct.add("checkbox", undefined, "Live Preview");
    var btnOk = gAct.add("button", undefined, "GENERATE");
    btnOk.size = [100, 40];

    // --- EVENTS ---

    chkRand.onClick = function() { inpStep.enabled = !this.value; updatePreview(); }

    dropMode.onChange = function() {
        inpRangeSep.enabled = (this.selection.index > 0);
        updatePreview();
    }

    dropColor.onChange = function() { gC2.enabled = (this.selection.index > 0); updatePreview(); }
    chkLine.onClick = function() { gLineOpts.enabled = gLineDims.enabled = this.value; updatePreview(); }

    btnPick1.onClick = function() { if(openColorPicker(inpC1r, inpC1g, inpC1b)) updatePreview(); }
    btnPick2.onClick = function() { if(openColorPicker(inpC2r, inpC2g, inpC2b)) updatePreview(); }

    btnGetFont.onClick = function() {
        if(app.selection.length > 0 && app.selection[0].typename === "TextFrame") {
            try {
                inpFont.text = app.selection[0].textRange.characterAttributes.textFont.name;
                inpSize.text = Math.round(app.selection[0].textRange.characterAttributes.size);
                updatePreview();
            } catch(e) { alert("Error reading font."); }
        } else { alert("Select a text object first."); }
    }

    var inputs = [inpStart, inpEnd, inpStep, inpPre, inpSuf, inpDec, inpFont, inpSize, inpSpace, inpC1r, inpC1g, inpC1b, inpC2r, inpC2g, inpC2b, inpLThick, inpLLen, inpRangeSep];
    for(var i=0; i<inputs.length; i++) inputs[i].onChanging = function() { updatePreview(); }

    dropDir.onChange = function() { updatePreview(); }
    dropLinePos.onChange = function() { updatePreview(); }
    chkRev.onClick = function() { updatePreview(); } // New Event
    chkSep.onClick = function() { updatePreview(); }

    function updatePreview() { if(chkPreview.value) generate(true); }

    chkPreview.onClick = function() {
        if(!this.value) {
            try { doc.layers.getByName(previewLayerName).remove(); app.redraw(); } catch(e){}
        } else { generate(true); }
    }

    btnOk.onClick = function() {
        if (chkPreview.value) {
             chkPreview.value = false;
             try { doc.layers.getByName(previewLayerName).remove(); } catch(e){}
        }
        win.close();
        generate(false);
    }

    // --- GENERATOR CORE ---
    function generate(isPreview) {
        var st = parseFloat(inpStart.text); if(isNaN(st)) st = 0;
        var en = parseFloat(inpEnd.text); if(isNaN(en)) en = 100;
        var stepInput = parseFloat(inpStep.text); if(isNaN(stepInput)) stepInput = 10;

        var isDescending = (st > en);
        var baseStep = Math.abs(stepInput);
        if (isDescending) baseStep = -baseStep;

        var isRand = chkRand.value;
        var modeIdx = dropMode.selection.index;
        var rSep = inpRangeSep.text;

        var dec = parseInt(inpDec.text); if(isNaN(dec)) dec = 0;
        var pre = inpPre.text;
        var suf = inpSuf.text;
        var useSep = chkSep.value;
        var fName = inpFont.text;
        var fSize = parseFloat(inpSize.text) || 12;
        var isVert = (dropDir.selection.index === 0);
        var isRev = chkRev.value; // REVERSE LAYOUT FLAG
        var spacing = parseFloat(inpSpace.text) || 10;

        var cMode = dropColor.selection.index;
        var c1 = [parseFloat(inpC1r.text), parseFloat(inpC1g.text), parseFloat(inpC1b.text)];
        var c2 = [parseFloat(inpC2r.text), parseFloat(inpC2g.text), parseFloat(inpC2b.text)];
        var doLine = chkLine.value;
        var linePos = dropLinePos.selection.index;
        var lW = parseFloat(inpLThick.text) || 1;
        var lL = parseFloat(inpLLen.text) || 10;

        var container;
        if (isPreview) {
            try { doc.layers.getByName(previewLayerName).remove(); } catch(e){}
            container = doc.layers.add();
            container.name = previewLayerName;
        } else {
            container = doc.activeLayer.groupItems.add();
            container.name = "Chart_Data";
        }

        function fmt(n) {
            var fixedN = parseFloat(n.toFixed(dec + 5));
            var s = fixedN.toFixed(dec);
            if (useSep) {
                var p = s.split(".");
                p[0] = p[0].replace(/\B(?=(\d{3})+(?!\d))/g, ",");
                s = p.join(".");
            }
            return s;
        }

        var cur = st;
        var pos = 0;
        var idx = 0;
        var limit = isPreview ? 200 : 3000;
        var totalDist = Math.abs(en - st);
        if(totalDist === 0) totalDist = 1;

        while (true) {
            if (idx > limit) break;
            if (isDescending) { if (cur < en) break; }
            else { if (cur > en) break; }

            var thisStep = baseStep;
            if (isRand) {
                var rn = Math.random() * 9 + 1;
                thisStep = (isDescending ? -rn : rn);
            }

            // String Logic
            var str = "";
            var isFinalValue = (Math.abs(cur - en) < 0.0001);

            if (modeIdx > 0) {
                if (isFinalValue) {
                    str = pre + fmt(cur) + suf;
                } else {
                    var nextVal = cur + thisStep;
                    var displayEnd = nextVal;
                    if (modeIdx === 2) {
                        if (isDescending) displayEnd = nextVal + 1;
                        else displayEnd = nextVal - 1;
                    }
                    if (modeIdx === 1) {
                         if (!isDescending && displayEnd > en) displayEnd = en;
                         if (isDescending && displayEnd < en) displayEnd = en;
                    }
                    str = pre + fmt(cur) + rSep + fmt(displayEnd) + suf;
                }
            } else {
                str = pre + fmt(cur) + suf;
            }

            // Build Graphics
            var grp = container.groupItems.add();
            var tf = grp.textFrames.add();
            tf.contents = str;
            tf.textRange.characterAttributes.size = fSize;
            try { tf.textRange.characterAttributes.textFont = app.textFonts.getByName(fName); } catch(e){}

            var finalColor = makeRGB(c1[0], c1[1], c1[2]);
            if (cMode === 1 && (idx % 2 !== 0)) {
                 finalColor = makeRGB(c2[0], c2[1], c2[2]);
            } else if (cMode === 2) {
                 var pct = Math.abs(cur - st) / totalDist;
                 if (pct > 1) pct = 1;
                 var r = c1[0] + (c2[0] - c1[0]) * pct;
                 var g = c1[1] + (c2[1] - c1[1]) * pct;
                 var b = c1[2] + (c2[2] - c1[2]) * pct;
                 finalColor = makeRGB(r, g, b);
            }
            tf.textRange.characterAttributes.fillColor = finalColor;

            if (doLine) {
                var ln = grp.pathItems.add();
                var b = tf.geometricBounds;
                var x1, y1, x2, y2;
                var pad = 4;

                if (isVert) {
                    var midY = b[1] - (tf.height/2);
                    if (linePos === 0) { x2 = b[0] - pad; x1 = x2 - lL; }
                    else { x1 = b[2] + pad; x2 = x1 + lL; }
                    y1 = y2 = midY;
                } else {
                    var midX = b[0] + (tf.width/2);
                    if (linePos === 0) { y2 = b[1] + pad; y1 = y2 + lL; }
                    else { y1 = b[3] - pad; y2 = y1 - lL; }
                    x1 = x2 = midX;
                }
                ln.setEntirePath([[x1, y1], [x2, y2]]);
                ln.strokeWidth = lW;
                ln.filled = false;
                ln.stroked = true;
                ln.strokeColor = finalColor;
            }

            // --- LAYOUT DIRECTION LOGIC ---
            if (isVert) {
                // Normal: Top to Bottom (Negative Y)
                // Reverse: Bottom to Top (Positive Y)
                grp.position = [0, isRev ? pos : -pos];
                pos += grp.height + spacing;
            } else {
                // Normal: Left to Right (Positive X)
                // Reverse: Right to Left (Negative X)
                grp.position = [isRev ? -pos : pos, 0];
                pos += grp.width + spacing;
            }

            cur += thisStep;
            idx++;
        }

        if (isPreview) app.redraw();
    }

    win.center();
    win.show();

})();