Adobe Illustrator Script: Blank Graph Creator
Description
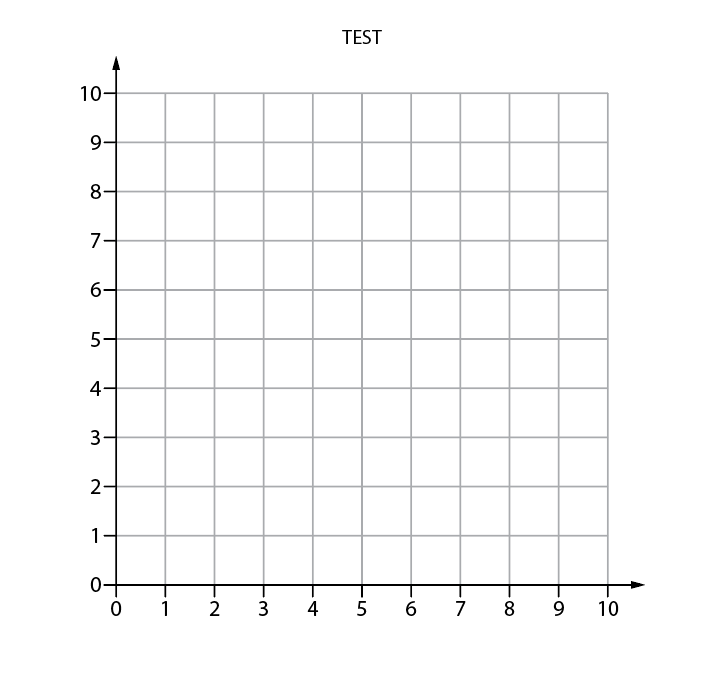
This Adobe Illustrator script creates a blank graph with customizable grid lines, axis labels, and graph title. The script generates a user interface to input the parameters for the graph and then draws the graph based on those parameters.
Usage
- Open Adobe Illustrator.
- Create or open a document.
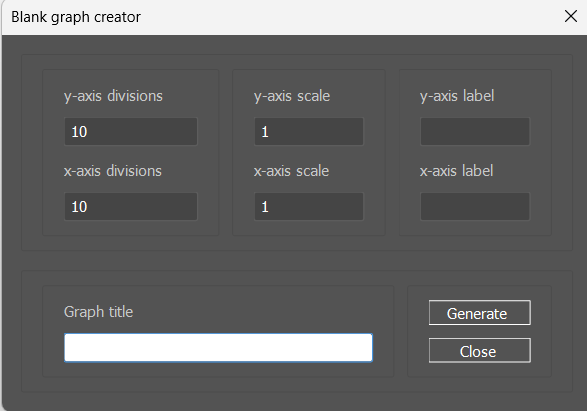
- Run the script. A graphical user interface will appear.
- Fill in the following fields in the interface:
- y-axis divisions: Number of vertical divisions.
- x-axis divisions: Number of horizontal divisions.
- y-axis scale: Multiplier for vertical divisions.
- x-axis scale: Multiplier for horizontal divisions.
- y-axis label: Label for the vertical axis.
- x-axis label: Label for the horizontal axis.
- Graph title: Title to be displayed above the graph.
- Click the “Generate” button to create the graph.
- The script will draw the graph based on the input parameters.
Script Details
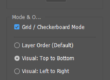
User Interface
- Vertical Divisions: Input field for the number of vertical divisions.
- Horizontal Divisions: Input field for the number of horizontal divisions.
- Vertical Multiplier: Input field for the vertical division multiplier.
- Horizontal Multiplier: Input field for the horizontal division multiplier.
- Vertical Axis Label: Input field for the vertical axis label.
- Horizontal Axis Label: Input field for the horizontal axis label.
- Graph Title: Input field for the graph title.
- Generate Button: Button to generate the graph.
- Close Button: Button to close the interface.
Graph Creation
- Horizontal Axis Marks: Adds labels and marks for the horizontal axis based on the input parameters.
- Vertical Axis Marks: Adds labels and marks for the vertical axis based on the input parameters.
- Grid Lines: Draws vertical and horizontal grid lines based on the input parameters.
- Axes: Draws the x and y axes with arrows.
- Axis Labels: Adds labels for the x and y axes.
- Graph Title: Adds a title above the graph.
JavaScript
// Graph Creator Script - Fixed & Optimized
// Updated to fix UI bugs, variable types, and add auto-centering/margins

// Ensure a document exists
if (app.documents.length === 0) {
    app.documents.add(DocumentColorSpace.CMYK, 600, 600);
}

var doc = app.activeDocument;
var piRef = doc.pathItems;
var txRef = doc.textFrames;

// Define Colors
var pureBlack = new CMYKColor();
pureBlack.cyan = 0;
pureBlack.magenta = 0;
pureBlack.yellow = 0;
pureBlack.black = 100;

var gridColor = new CMYKColor();
gridColor.cyan = 0;
gridColor.magenta = 0;
gridColor.yellow = 0;
gridColor.black = 39;

startGUI();

function startGUI() {
    var win = new Window("dialog", "Blank graph creator", undefined);
    win.orientation = "column";
    win.alignChildren = ["fill", "fill"];

    // --- Inputs ---
    var firstGroup = win.add("panel", undefined, undefined);
    firstGroup.orientation = "row";
    firstGroup.alignChildren = ["fill", "fill"];

    var secondGroup = win.add("panel", undefined, undefined);
    secondGroup.orientation = "row";
    secondGroup.alignChildren = ["fill", "fill"];

    // Column 1: Ticks
    var groupOne = firstGroup.add("panel", undefined, undefined);
    groupOne.orientation = "column";
    groupOne.alignChildren = ["fill", "fill"];

    groupOne.add("statictext", undefined, "y-axis divisions");
    var txt_vTicks = groupOne.add("edittext { characters: 6, justify: 'left', active: true }");
    txt_vTicks.helpTip = "Vertical divisions (Integers)";
    txt_vTicks.text = "10";

    groupOne.add("statictext", undefined, "x-axis divisions");
    var txt_hTicks = groupOne.add("edittext { characters: 6, justify: 'left', active: true }");
    txt_hTicks.helpTip = "Horizontal divisions (Integers)";
    txt_hTicks.text = "10";

    // Column 2: Scale
    var groupTwo = firstGroup.add("panel", undefined, undefined);
    groupTwo.orientation = "column";
    groupTwo.alignChildren = ["fill", "fill"];

    groupTwo.add("statictext", undefined, "y-axis scale");
    var txt_yMult = groupTwo.add("edittext { characters: 6, justify: 'left', active: true }");
    txt_yMult.helpTip = "Vertical division multiplier (Number)";
    txt_yMult.text = "1";

    groupTwo.add("statictext", undefined, "x-axis scale");
    var txt_xMult = groupTwo.add("edittext { characters: 6, justify: 'left', active: true }");
    txt_xMult.helpTip = "Horizontal division multiplier (Number)";
    txt_xMult.text = "1";

    // Column 3: Labels
    var groupThree = firstGroup.add("panel", undefined, undefined);
    groupThree.orientation = "column";
    groupThree.alignChildren = ["fill", "fill"];

    groupThree.add("statictext", undefined, "y-axis label");
    var txt_yLabel = groupThree.add("edittext { characters: 6, justify: 'left', active: true }");
    txt_yLabel.helpTip = "Vertical axis label"; // Fixed variable reference

    groupThree.add("statictext", undefined, "x-axis label");
    var txt_xLabel = groupThree.add("edittext { characters: 6, justify: 'left', active: true }");
    txt_xLabel.helpTip = "Horizontal axis label"; // Fixed variable reference

    txt_vTicks.active = true;

    // --- Title ---
    var groupFour = secondGroup.add("panel", undefined, undefined);
    groupFour.orientation = "column";
    groupFour.alignChildren = ["fill", "fill"];

    groupFour.add("statictext", undefined, "Graph title");
    var txt_graphTitle = groupFour.add("edittext { characters: 24, justify: 'left', active: true }");
    txt_graphTitle.helpTip = "Title to be displayed above graph";

    // --- Buttons ---
    var groupFive = secondGroup.add("panel", undefined, undefined);
    groupFive.orientation = "column";
    groupFive.alignChildren = ["fill", "fill"];

    var genBtn = groupFive.add("button", undefined, "Generate");
    genBtn.maximumSize = [100, 20];
    genBtn.helpTip = "Generate graph";

    var quitBtn = groupFive.add("button", undefined, "Close");
    quitBtn.helpTip = "Press Esc to close";
    quitBtn.maximumSize = [100, 20];

    // Logic to run on Enter or Click
    var runGeneration = function() {
        createGraph(
            txt_yMult.text,
            txt_xMult.text,
            txt_vTicks.text,
            txt_hTicks.text,
            txt_yLabel.text,
            txt_xLabel.text,
            txt_graphTitle.text
        );
        win.close();
    }

    genBtn.onClick = runGeneration;
    quitBtn.onClick = function() { win.close(); }

    // Key listener
    win.addEventListener("keydown", function(k) {
        if (k.keyname == "Enter") {
            runGeneration();
        }
    });

    win.center();
    win.show();
};

function createGraph(yMultIn, xMultIn, vTicksIn, hTicksIn, yLabel, xLabel, graphTitle) {

    // 1. Convert Inputs to Numbers (Crucial Fix)
    var yMult = parseFloat(yMultIn);
    var xMult = parseFloat(xMultIn);
    var vTicks = parseInt(vTicksIn);
    var hTicks = parseInt(hTicksIn);

    // Validate inputs
    if (isNaN(yMult) || isNaN(xMult) || isNaN(vTicks) || isNaN(hTicks)) {
        alert("Please enter valid numbers for Ticks and Scales.");
        return;
    }

    // 2. Create a Group to hold everything (For easier centering)
    var graphGroup = doc.groupItems.add();
    graphGroup.name = "Generated Graph";

    // draw x-axis numbers
    for (var i = 0; i <= hTicks; i++) {
        var tx = graphGroup.textFrames.add();
        // Fix floating point math errors (e.g. 0.300000004)
        var numVal = i * xMult;
        tx.contents = Math.round(numVal * 100) / 100;

        tx.top = -2.5;
        tx.left = (i * 20); // Center alignment adjustment is handled by justification below

        var charCount = tx.textRange.characters.length;
        for (var j = 0; j < charCount; j++) {
            var txChar = tx.textRange.characters[j].characterAttributes;
            var txPara = tx.textRange.paragraphs[0].paragraphAttributes;
            txChar.size = 9;
            txChar.fillColor = pureBlack;
            txPara.justification = Justification.CENTER;
        }
        // Visually align center text relative to the tick
        tx.left = (i * 20) - (tx.width / 2);
    }

    // add y-axis mark labels
    for (var i = 0; i <= vTicks; i++) {
        var tx = graphGroup.textFrames.add();
        var numVal = i * yMult;
        tx.contents = Math.round(numVal * 100) / 100;

        tx.top = (i * 20) + 3; // Slight adjustment for baseline
        tx.left = -6;

        var charCount = tx.textRange.characters.length;
        for (var j = 0; j < charCount; j++) {
            var txChar = tx.textRange.characters[j].characterAttributes;
            var txPara = tx.textRange.paragraphs[0].paragraphAttributes;
            txChar.size = 9;
            txChar.fillColor = pureBlack;
            txPara.justification = Justification.RIGHT;
        }
        tx.left = -6 - tx.width; // Align right side to the tick
    }

    // draw x-axis marks
    for (var i = 0; i <= hTicks; i++) {
        var ticks = graphGroup.pathItems.add();
        ticks.setEntirePath([[0, 0], [0, 5]]);
        var left = i * 20;
        var top = 0;
        ticks.position = [left, top]; // Note: Position sets top-left

        ticks.stroked = true;
        ticks.strokeColor = pureBlack;
        ticks.strokeWidth = 0.5;
    }

    // draw y-axis marks
    for (var i = 0; i <= vTicks; i++) {
        var ticks = graphGroup.pathItems.add();
        ticks.setEntirePath([[5, 0], [0, 0]]);
        var left = -5;
        var top = i * 20;
        ticks.position = [left, top];

        ticks.stroked = true;
        ticks.strokeColor = pureBlack;
        ticks.strokeWidth = 0.5;
    }

    // draw vertical gridlines
    for (var i = 0; i < hTicks; i++) {
        var grid = graphGroup.pathItems.add();
        grid.setEntirePath([[0, (vTicks * 20)], [0, 0]]);
        var left = (i + 1) * 20;
        var top = vTicks * 20;
        grid.position = [left, top];

        grid.stroked = true;
        grid.filled = false;
        grid.strokeColor = gridColor;
        grid.strokeWidth = 0.5;
    }

    // draw horizontal gridlines
    for (var i = 0; i < vTicks; i++) {
        var grid = graphGroup.pathItems.add();
        grid.setEntirePath([[(hTicks * 20), 0], [0, 0]]);
        var left = 0;
        var top = (i + 1) * 20;
        grid.position = [left, top];

        grid.stroked = true;
        grid.filled = false;
        grid.strokeColor = gridColor;
        grid.strokeWidth = 0.5;
    }

    // draw x and y axes
    var hSize = (hTicks * 20) + 10;
    var vSize = (vTicks * 20) + 10;

    var axes = graphGroup.pathItems.add();
    axes.setEntirePath([[hSize, 0], [0, 0], [0, vSize]]);
    axes.filled = false;
    axes.stroked = true;
    axes.strokeColor = pureBlack;
    axes.strokeWidth = 0.5;

    // draw x axis arrow
    var xArrow = graphGroup.pathItems.add();
    xArrow.setEntirePath([[0, 0], [0, 2.905], [5.42, 1.453], [0, 0]]);
    xArrow.filled = true;
    xArrow.stroked = false;
    xArrow.fillColor = pureBlack;
    xArrow.top = 1.453;
    xArrow.left = (hTicks * 20) + 9.58;

    // draw y axis arrow
    var yArrow = graphGroup.pathItems.add();
    yArrow.setEntirePath([[0, 0], [1.452, 5.42], [2.905, 0], [0, 0]]);
    yArrow.filled = true;
    yArrow.stroked = false;
    yArrow.fillColor = pureBlack;
    yArrow.top = (vTicks * 20) + 15;
    yArrow.left = -1.453;

    // add x axis label
    if (xLabel.length > 0) {
        var tx = graphGroup.textFrames.add();
        tx.contents = xLabel;
        tx.top = -15;

        var charCount = tx.textRange.characters.length;
        for (var j = 0; j < charCount; j++) {
            var txChar = tx.textRange.characters[j].characterAttributes;
            var txPara = tx.textRange.paragraphs[0].paragraphAttributes;
            txChar.size = 8;
            txChar.fillColor = pureBlack;
            txPara.justification = Justification.CENTER;
        }
        // Center label relative to axis
        tx.left = ((hTicks * 20) / 2) - (tx.width / 2);
    }

    // add y axis label
    if (yLabel.length > 0) {
        var tx = graphGroup.textFrames.add();
        tx.contents = yLabel;

        // Positioning logic based on text length to prevent overlap
        // We roughly estimate shift based on the characters in yMult
        var yShift = yMultIn.length;

        tx.top = ((vTicks * 20) / 2); // Center vertically roughly
        tx.left = -25 - (yShift * 4.5);

        var charCount = tx.textRange.characters.length;
        for (var j = 0; j < charCount; j++) {
            var txChar = tx.textRange.characters[j].characterAttributes;
            var txPara = tx.textRange.paragraphs[0].paragraphAttributes;
            txChar.size = 8;
            txChar.fillColor = pureBlack;
            txPara.justification = Justification.CENTER;
        }
        tx.rotate(90);
    }

    // add graph title
    if (graphTitle.length > 0) {
        var tx = graphGroup.textFrames.add();
        tx.contents = graphTitle;
        tx.top = (vTicks * 20) + 30;

        var charCount = tx.textRange.characters.length;
        for (var j = 0; j < charCount; j++) {
            var txChar = tx.textRange.characters[j].characterAttributes;
            var txPara = tx.textRange.paragraphs[0].paragraphAttributes;
            txChar.size = 8;
            txChar.fillColor = pureBlack;
            txPara.justification = Justification.CENTER;
        }
        // Center title
        tx.left = ((hTicks * 20) / 2) - (tx.width / 2);
    }

    // 3. FIT ARTBOARD AND CENTER VIEW
    resizeArtboardToGroup(graphGroup);
};

function resizeArtboardToGroup(group) {
    // Select the group to ensure we get correct bounds
    doc.selection = null;
    group.selected = true;

    // Get geometric bounds [left, top, right, bottom]
    // Note: In Illustrator script, Y is positive up, but bounds returns:
    // [x1, y1, x2, y2] where y1 is top (positive) and y2 is bottom (less positive or negative)
    var bounds = group.visibleBounds;
    var gLeft = bounds[0];
    var gTop = bounds[1];
    var gRight = bounds[2];
    var gBottom = bounds[3];

    var margin = 50; // Points

    // Calculate new rect
    var newRect = [
        gLeft - margin,
        gTop + margin,
        gRight + margin,
        gBottom - margin
    ];

    // Resize Artboard
    doc.artboards[0].artboardRect = newRect;

    // Zoom to fit
    app.activeDocument.views[0].zoom = 1; // Reset zoom to force recalc
    app.activeDocument.views[0].zoom = Object.isValid(ZoomOptions) ? ZoomOptions.FIT_ON_SCREEN : 1;

    // Deselect
    group.selected = false;
}