Title: Pixel‑Perfect Parliament Diagrams in Adobe Illustrator — A Practical Guide for Graphic and Motion Designers

If you’ve ever tried to lay out hundreds of perfectly spaced dots in a clean semicircle, you know how fiddly it can be. Parliament (a.k.a. hemicycle) diagrams look simple, but getting the bottom edge to read as a smooth arc and keeping spacing consistent across rows is where most attempts fall apart.
This article is a designer‑friendly walkthrough of a new Illustrator script that builds flawless parliament diagrams in seconds. It’s tuned for production: crisp spacing, clean bottom edge, and adjustable geometry for print, broadcast, and motion graphics.
What you’ll get
- A ready‑to‑run Illustrator script that generates pro‑quality hemicycles.
- Controls for seat size, arc span, row density, margins, and centering.
- Reliable output you can color, label, export, and animate.
Background (in plain language)
We adapted the best ideas from three open‑source projects:
- slashme/parliamentdiagram — robust compositional thinking about how to manage rows, spacing, and blocks.
- elexnuk/arches — the cleanest “seat geometry” we’ve found; it keeps the bottom band visually perfect.
- Teester/parliament-diagram-generator — a thoughtful approach to distributing seats across rings.
Translated for designers, this means:
- The bottom edge is clean because each row trims its endpoints so dots don’t “flatten” into the baseline.
- Seats keep a consistent feel across rows (no bunching or drifting).
- The total seat count is respected while staying visually balanced.

What the script does
- Places dots along multiple concentric arcs (rows).
- Even spacing within each row (no overlaps).
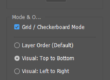
- Optional “dense rows” mode to avoid skinny inner rows when your seat count is small.
- Works with any arc span (e.g., a 160°, 180°, or 200° hemicycle).
Installing the script
- macOS
- Save the file ParliamentDiagramGenerator.jsx.
- Move it to: Applications/Adobe Illustrator [version]/Presets/en_US/Scripts
- Restart Illustrator.
- Windows
- Save the file ParliamentDiagram_ArchesAdapted_v2.jsx.
- Move it to: C:\Program Files\Adobe\Adobe Illustrator [version]\Presets\en_US\Scripts
- Restart Illustrator.
- Alternative: File > Scripts > Other Script… (browse to the .jsx each time).
How to use
1) Open or create an Illustrator document.
2) Run: File > Scripts > Parliament (Arches‑adapted v2)
3) Set parameters:
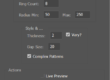
- Total seats: the total number of dots you need.
- Seat diameter (pt): visual size of each dot. For broadcast 1080p, 6–12 pt is a good range.
- Span angle (deg): width of the arc (180 is a classic hemicycle; 160 feels a bit tighter).
- Force rows (0 = auto): leave at 0 to let the script pick; set a number if your art direction demands it.
- Dense rows: turns off unused inner rows so smaller totals look tight and intentional.
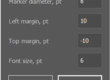
- Outer margin: padding from your diagram to the canvas edge.
- Centering: place the diagram dead‑center or aligned to your layout grid as needed.
Designer‑friendly recipes
- News lower‑third or small infographics
- 120–240 seats, 160° span, Dense rows ON
- Seat diameter 6–8 pt, Outer margin 24 pt
- Full‑screen broadcast explainer (1920×1080)
- 300–700 seats, 180° span, Dense rows OFF (to keep inner layers present)
- Seat diameter 8–12 pt
- A4/Letter print report
- 200–600 seats, 170–180° span
- Seat diameter 6–10 pt, Outer margin 18–24 pt
Coloring and labeling (fast workflows)
- Global color: Select the generated group and set Fill.
- Party color assignment:
- Quick way: Use the Lasso Tool to select contiguous seat clusters by row and recolor. Because spacing is uniform, selections are predictable.
- Methodical way: Ungroup once, then group rows (or arcs) and color by segments for consistent blocks.
- Labels: Add a centerline title or an outer arc legend. Keep text off the seat dots for clarity; place totals or party names just outside the curve.
Exporting for every medium
- Print/PDF: Save As > Adobe PDF (Preserve Illustrator Editing Capabilities ON if you’ll revise later).
- Web/SVG: Export As > SVG (Presentation Attributes ON, Responsive OFF for predictable sizes).
- Motion/After Effects:
- Import the .ai as Composition – Retain Layer Sizes.
- Convert to Shape Layers to animate stroke/fill or per‑row reveals.
- Add Trim Paths to build “row sweeps,” or use Opacity/Scale to pop in dots by arc.
Troubleshooting
- “Too tight at the bottom” or flattened edge
- Increase span angle a bit (e.g., 160 → 175).
- Increase Seat diameter slightly or toggle Dense rows ON.
- Overlapping dots on outer rows
- Reduce Seat diameter or increase Force rows by +1.
- Looks off‑center
- Turn off centering and place the group using your grid or guides.
- Performance with very large counts (1,000+)
- Reduce seat diameter, disable GPU preview temporarily, and keep the diagram in its own layer.
Why this looks better than most
- Constant‑chord spacing: Seats are positioned so the straight‑line distance between neighbors is consistent per row.
- End‑trim margins: Each row trims a small angle at both ends, preventing the bottom band from looking “crushed.”
- Capacity‑aware: The script calculates how many seats reasonably fit per row and distributes your total accordingly.
Accessibility and clarity tips
- Use color palettes with sufficient contrast for those with color‑vision deficiencies.
- Add a monochrome fallback or patterned overlays if the design must work in grayscale.
- Keep seat size consistent across related graphics so visual comparisons read correctly.
Roadmap ideas (tell us if you want these)
- Party data input (counts + colors) to auto‑color seats in order.
- “Staggered rows” style toggle for a different texture.
- Legend and total rendering as optional layers.
(function () {
    if (app.documents.length === 0) {
        alert("Open or create a document, then run the script again.");
        return;
    }

    var doc = app.activeDocument;

    // -------- UI --------
    var dlg = new Window("dialog", "Parliament (Arches-adapted v2)");
    dlg.orientation = "column";
    dlg.alignChildren = "fill";

    var p1 = dlg.add("panel", undefined, "Layout");
    p1.orientation = "column"; p1.margins = 12;

    var gSeats = p1.add("group");
    gSeats.add("statictext", undefined, "Total seats:");
    var uiSeats = gSeats.add("edittext", undefined, "577"); uiSeats.characters = 6;

    var gSeatSize = p1.add("group");
    gSeatSize.add("statictext", undefined, "Seat diameter (pt):");
    var uiSeatDia = gSeatSize.add("edittext", undefined, "10"); uiSeatDia.characters = 6;

    var gSpan = p1.add("group");
    gSpan.add("statictext", undefined, "Span angle (deg):");
    var uiSpan = gSpan.add("edittext", undefined, "180"); uiSpan.characters = 5;

    var gForceRows = p1.add("group");
    gForceRows.add("statictext", undefined, "Force rows (0=auto):");
    var uiRows = gForceRows.add("edittext", undefined, "0"); uiRows.characters = 4;

    var gDense = p1.add("group");
    var uiDense = gDense.add("checkbox", undefined, "Dense rows (discard inner rows)");
    uiDense.value = false;

    var p2 = dlg.add("panel", undefined, "Canvas and options");
    p2.orientation = "column"; p2.margins = 12;

    var gMargin = p2.add("group");
    gMargin.add("statictext", undefined, "Outer margin (pt):");
    var uiMargin = gMargin.add("edittext", undefined, "24"); uiMargin.characters = 6;

    var gCenter = p2.add("group");
    var uiCenterHoriz = gCenter.add("checkbox", undefined, "Center horizontally");
    uiCenterHoriz.value = true;
    var uiCenterVert = gCenter.add("checkbox", undefined, "Center vertically");
    uiCenterVert.value = true;

    var gBtns = dlg.add("group");
    gBtns.alignment = "right";
    gBtns.add("button", undefined, "Cancel", { name: "cancel" });
    var btnOk = gBtns.add("button", undefined, "Generate", { name: "ok" });

    btnOk.onClick = function () {
        var totalSeats = parseInt(uiSeats.text, 10);
        var seatDiameterPt = parseFloat(uiSeatDia.text);
        var spanAngleDeg = parseFloat(uiSpan.text);
        var forceRows = parseInt(uiRows.text, 10);
        var marginPt = parseFloat(uiMargin.text);

        if (!(totalSeats > 0 && seatDiameterPt > 0 && marginPt >= 0) ||
            isNaN(spanAngleDeg) || isNaN(forceRows)) {
            alert("Please enter valid numeric values.");
            return;
        }
        if (spanAngleDeg <= 0 || spanAngleDeg > 360) {
            alert("Span angle must be in (0, 360].");
            return;
        }

        dlg.close();
        try {
            generateDiagram({
                totalSeats: totalSeats,
                seatDiameterPt: seatDiameterPt,
                spanAngleDeg: spanAngleDeg,
                marginPt: marginPt,
                forceRows: Math.max(0, forceRows),
                denseRows: uiDense.value,
                centerHoriz: uiCenterHoriz.value,
                centerVert: uiCenterVert.value
            });
        } catch (e) {
            alert("Error: " + e);
        }
    };

    dlg.show();

    // -------- Core geometry (arches generalized to any span) --------

    function clamp(v, lo, hi) { return Math.max(lo, Math.min(hi, v)); }

    function rowRadiusNormalized(R, i) {
        // i = 1..R (1 is innermost)
        return (3 * R + 4 * i - 2) / (4 * R);
    }

    function normalizedCircleRadius(R) { return 0.4 / R; }

    function perRowCapacity(R, i, spanRad) {
        var cR = normalizedCircleRadius(R);
        var r = rowRadiusNormalized(R, i);

        var ratio = clamp(cR / r, -1, 1);
        var margin = Math.asin(ratio);       // trim both ends
        var avail = Math.max(0, spanRad - 2 * margin);

        var step = 2 * Math.asin(ratio);     // constant-chord spacing
        if (step <= 0) return 1;

        var n = Math.floor(avail / step) + 1;
        return Math.max(1, n);
    }

    function totalCapacityForRows(R, spanRad) {
        var sum = 0;
        for (var i = 1; i <= R; i++) sum += perRowCapacity(R, i, spanRad);
        return sum;
    }

    function chooseRowCount(totalSeats, spanRad) {
        for (var R = 1; R <= 100; R++) {
            if (totalCapacityForRows(R, spanRad) >= totalSeats) return R;
        }
        return 100;
    }

    // Dense rows optimization: discard inner rows to pack seats visually
    function optimizeRows(totalSeats, R, spanRad) {
        var handled = 0;
        for (var i = R; i >= 1; i--) {
            var cap = Math.floor(perRowCapacity(R, i, spanRad)); // integer capacity
            handled += cap;
            if (handled >= totalSeats) {
                var wastedRows = i - 1; // rows 1..(i-1) discarded
                var fullness = totalSeats / handled;
                return { discard: wastedRows, fullness: fullness };
            }
        }
        return { discard: 0, fullness: 0 };
    }

    function seatsPerRowDistribution(totalSeats, R, spanRad, dense) {
        var caps = [];
        for (var i = 1; i <= R; i++) caps.push(perRowCapacity(R, i, spanRad));

        var startRow = 1;
        var fullness;

        if (dense) {
            var opt = optimizeRows(totalSeats, R, spanRad);
            startRow = opt.discard + 1;
            fullness = opt.fullness;
        } else {
            var capSum = 0;
            for (var j = 0; j < caps.length; j++) capSum += caps[j];
            fullness = totalSeats / capSum;
        }

        var perRow = new Array(R);
        for (var i = 0; i < R; i++) perRow[i] = 0;

        var allocated = 0;
        // Fill rows startRow..R-1 proportionally
        for (var i = startRow; i <= R - 1; i++) {
            var idx = i - 1;
            var n = Math.floor(caps[idx] * fullness);
            n = Math.min(n, caps[idx]);
            perRow[idx] = n;
            allocated += n;
        }
        // Last (outermost) row gets the remainder
        perRow[R - 1] = Math.max(0, totalSeats - allocated);
        return { perRow: perRow, startRow: startRow };
    }

    function appendSeatPositionsForRow(R, i, seatsInRow, spanRad, scale) {
        // Returns array of [xPt, yPt]
        var pts = [];
        if (seatsInRow <= 0) return pts;

        var cR = normalizedCircleRadius(R);
        var rNorm = rowRadiusNormalized(R, i);

        var ratio = clamp(cR / rNorm, -1, 1);
        var margin = Math.asin(ratio);
        var trimmedSpan = Math.max(0, spanRad - 2 * margin);

        var rPt = rNorm * scale;

        // Center the arc on π/2. The untrimmed arc endpoints are:
        // L = (π - span)/2, H = (π + span)/2
        // After trimming by margin on both sides:
        var angleLow = (Math.PI - spanRad) / 2 + margin;
        var angleHigh = (Math.PI + spanRad) / 2 - margin;

        if (seatsInRow === 1 || trimmedSpan <= 0) {
            var a = Math.PI / 2;
            pts.push([rPt * Math.cos(a), rPt * Math.sin(a)]);
            return pts;
        }

        var step = trimmedSpan / (seatsInRow - 1);
        for (var j = 0; j < seatsInRow; j++) {
            var angle = angleLow + j * step;
            var x = rPt * Math.cos(angle);
            var y = rPt * Math.sin(angle);
            pts.push([x, y]);
        }
        return pts;
    }

    function buildAllSeatPositions(totalSeats, seatDiameterPt, spanAngleDeg, forceRows, denseRows) {
        var spanRad = (spanAngleDeg * Math.PI) / 180;

        var R = forceRows > 0 ? forceRows : chooseRowCount(totalSeats, spanRad);
        var cR = normalizedCircleRadius(R);
        var scale = seatDiameterPt / (2 * cR); // normalize -> pt

        var dist = seatsPerRowDistribution(totalSeats, R, spanRad, denseRows);
        var perRow = dist.perRow;
        var startRow = dist.startRow;

        var pts = [];
        for (var i = startRow; i <= R; i++) {
            var nRow = perRow[i - 1] || 0;
            if (nRow <= 0) continue;
            var rowPts = appendSeatPositionsForRow(R, i, nRow, spanRad, scale);
            pts = pts.concat(rowPts);
        }
        return { positions: pts, scale: scale };
    }

    // -------- Rendering --------

    function generateDiagram(opts) {
        var totalSeats = opts.totalSeats;
        var seatDia = opts.seatDiameterPt;
        var spanAngleDeg = opts.spanAngleDeg;
        var marginPt = opts.marginPt;

        var built = buildAllSeatPositions(
            totalSeats,
            seatDia,
            spanAngleDeg,
            opts.forceRows,
            opts.denseRows
        );

        var pts = built.positions;
        var layer = doc.activeLayer;
        var group = layer.groupItems.add();
        group.name = "Parliament (" + totalSeats + ", " + spanAngleDeg + "°)";

        var fillColor = new RGBColor(); fillColor.red = 0; fillColor.green = 0; fillColor.blue = 0;
        var r = seatDia / 2;

        // Bounds for centering
        var minX = 1e9, maxX = -1e9, minY = 1e9, maxY = -1e9;

        for (var i = 0; i < pts.length; i++) {
            var cx = pts[i][0], cy = pts[i][1];
            if (cx < minX) minX = cx; if (cx > maxX) maxX = cx;
            if (cy < minY) minY = cy; if (cy > maxY) maxY = cy;

            var seat = group.pathItems.ellipse(cy + r, cx - r, seatDia, seatDia);
            seat.stroked = false;
            seat.filled = true;
            seat.fillColor = fillColor;
        }

        // Centering
        var gx = (minX + maxX) / 2;
        var gy = (minY + maxY) / 2;

        var targetX = opts.centerHoriz ? (doc.width / 2) : (opts.marginPt + (maxX - minX) / 2);
        var diagramHeight = (maxY - minY) + 2 * r;
        var targetY = opts.centerVert ? (doc.height / 2) : (opts.marginPt + diagramHeight / 2);

        group.translate(targetX - gx, targetY - gy);
        app.redraw();
    }
})();