If you have ever tried to create a gold, copper, or zinc material in Redshift, you’ve probably stared at the color wheel, tweaking the “Reflectivity” and “Edge Tint” until it looked “close enough.”
But “close enough” isn’t physically accurate.
Today, I’m going to show you a workflow that removes the guesswork entirely. By using real-world optical data and the IOR to Metal Tints node in Redshift, we can recreate metals exactly as they behave in the physical world.
The Secret: Wavelengths, Not Colors
Redshift’s complex Fresnel calculations require two scientific values:
nn(Refractive Index)kk(Extinction Coefficient)
However, metals don’t just have one
nnvalue. They react differently to Red, Green, and Blue light. This is why Gold looks yellow (it reflects Red and Green light but absorbs Blue).
To get these values, we need to look up the data for three specific wavelengths of light.
The “Magic” Numbers
When using scientific databases, “Color” is measured in micrometers (
μμm). To get the RGB values for Redshift, use these three standard wavelengths:
- 🔴 Red: 0.65
μμm - 🟢 Green: 0.55
μμm - 🔵 Blue: 0.45
μμm
The Workflow: From Database to Render
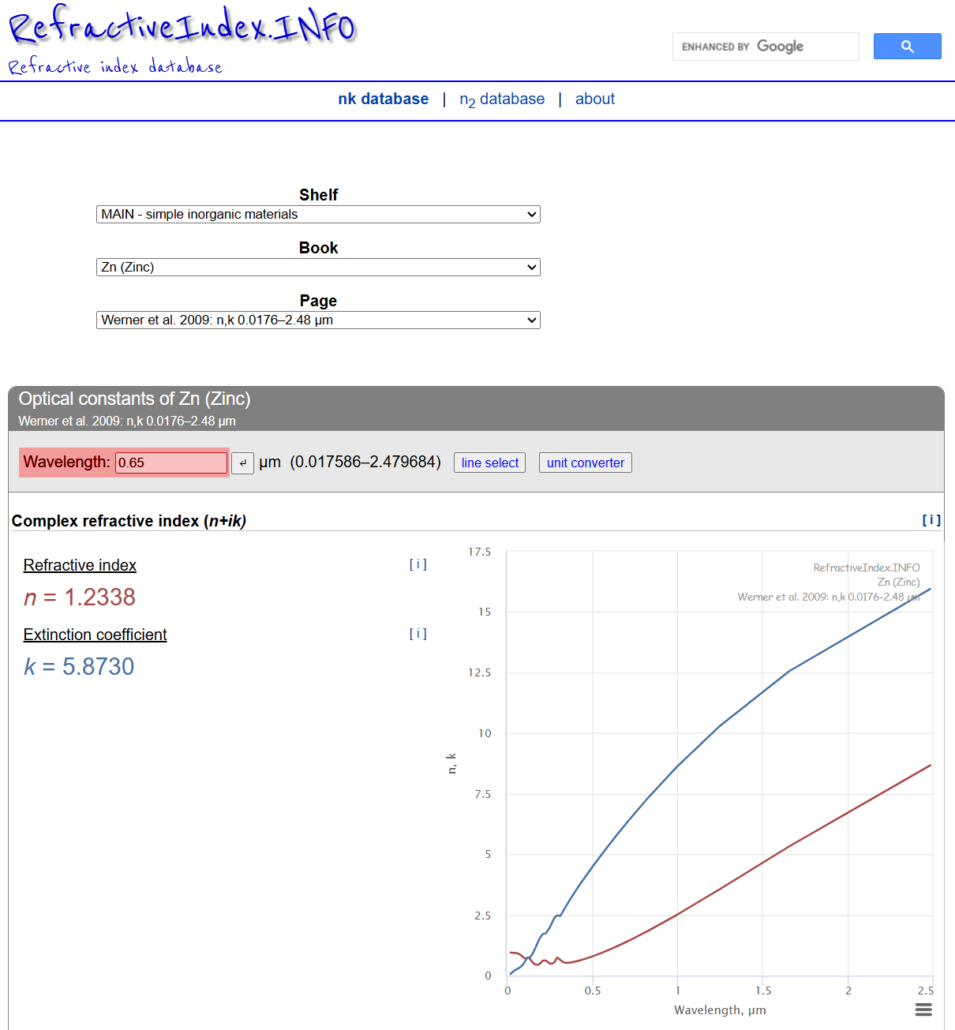
We will use RefractiveIndex.info, a free database of optical constants.
Step 1: Find Your Metal
- Go to refractiveindex.info.
- Shelf: Select Main (Simple inorganic materials).
- Book: Select your metal (e.g., Zn (Zinc), Au (Gold), Cu (Copper)).
- Page: Select a dataset (usually the top one or “Johnson and Christy” are reliable standards).
Step 2: Extract the Data (The “Triangulation” Method)
You need to grab the data three times—once for each color channel.
1. Get the RED values:
- Type 0.65 into the Wavelength box and press Enter.
- Scroll down to Complex refractive index.
- Write down the value for
nnandkk.
2. Get the GREEN values:
- Change the Wavelength to 0.55.
- Write down the new
nnandkk.
3. Get the BLUE values:
- Change the Wavelength to 0.45.
- Write down the final
nnandkk.
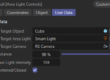
Step 3: Input into Redshift
- Open your Redshift Standard Material.
- Add an IOR to Metal Tints node (or use the Complex IOR settings inside the material).
- You will see inputs for
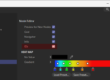
nnandkk(sometimes labeled Reflectivity and Edge Tint). - Click the color picker for
nnand input your three values manually:- R: (Value from 0.65 lookup)
- G: (Value from 0.55 lookup)
- B: (Value from 0.45 lookup)
- Repeat for the
kkinput.
Cheat Sheet: Common Scientific Metals
To save you some time, I have compiled the spectral data for the most common metals using this exact method.
🏆 Gold (Au)
nn(Refractive Index): R: 0.16 | G: 0.35 | B: 1.55kk(Extinction Coeff): R: 3.60 | G: 2.70 | B: 1.80
🥉 Copper (Cu)
nn(Refractive Index): R: 0.23 | G: 0.95 | B: 1.20kk(Extinction Coeff): R: 3.60 | G: 2.50 | B: 2.30
🔩 Zinc (Zn)
nn(Refractive Index): R: 1.23 | G: 0.93 | B: 0.68kk(Extinction Coeff): R: 5.87 | G: 4.67 | B: 3.63
💍 Silver (Ag)
nn(Refractive Index): R: 0.05 | G: 0.05 | B: 0.05kk(Extinction Coeff): R: 4.30 | G: 3.55 | B: 2.70
Final Pro-Tip: It’s Not Just About Color
Inputting these values gives you a scientifically perfect sphere of that metal. However, in the real world, materials have imperfections.
To achieve true photorealism, you must combine this accurate color data with:
- Roughness Maps: Break up the perfect reflection with surface imperfections (fingerprints, scratches).
- Anisotropy: If the metal is brushed or machined, you must increase anisotropy (usually 0.5 – 0.9) to simulate the micro-grooves on the surface.